Everyone enjoys a good contest, a battle between two worthy opponents. Well, the good news is, there’s one in the tech world. The mobile vs desktop discussion is one of the most pertinent conversations going today.
Determining trends is essential to consumer satisfaction. If companies do appropriate research, they can find out how their users consume content, interact, shop, and so much more. This information will dictate the direction of product advancement.
Knowing the correct mobile vs desktop usage statistics will play a factor in companies figuring out if they should focus on tailoring their offer to phone or desktop users.
All of this may shape your daily life, from how you conduct business to how you interact with friends. Thus, read on to find out which side the world’s leaning towards, as it is sure to affect you.
Top Facts and Stats on Mobile vs Desktop Usage (Editor’s Picks)
- Mobile traffic accounts for 51.92% of all online traffic.
- There are 4.08 billion active social media users on mobile.
- Desktop browsing time in the US makes up 58% of the total browsing time.
- 98.2% of people access Facebook from a mobile phone.
- 70% of YouTube watch time comes from mobile devices.
- 58% of the overall search query volume comes from mobile devices.
- People older than 65 spend 44% of their digital minutes on mobile apps.
General Mobile vs Desktop Traffic Statistics
Getting a bird’s eye view lets us know what the big picture looks like before we dissect many aspects of all these mobile vs desktop usage stats. We kick things off by answering the most relevant question – how much web traffic is mobile?
1. Mobile traffic accounts for 55% of all global online traffic in 2021.
(Statista)
More than half of the world’s population browses the internet from the palm of their hand. According to mobile statistics, this percentage has been consistently hovering around the 50% mark since the start of 2017. А dip occurred at around the end of 2018, as the percentage fell to 47.19%. It made a comeback a year later to above 50%. Currently, the percentage of mobile users vs desktop ones is at a standstill, though expect mobile numbers to climb, as there are more than 300 million new mobile users each year.
2. Global mobile web usage will hit 77.5 exabytes per month by 2022.
(Statista)
This number may not seem impressive if you’re not aware of the historical data. If you’re not, we’ll help. In 2018, the global mobile traffic amounted to 19.01 exabytes per month. Today, many developing markets are mobile-first. They are leapfrogging desktop access due to infrastructural restraints. Mobile gaming and app downloads are only a few activities that require a fast broadband connection through a mobile phone. Asia and Africa have a higher share of mobile traffic than the global average, and some European countries are approaching similar ratios.
3. Going by mobile browsing stats, three in four internet users will be mobile-only by 2025.
(Warc)
Not only are people spending more time online as the years go by, but more are doing so via only their mobile phones. Desktop internet access will become an exception in the future, as GSMA statistics claim that the number of mobile-only users will hit 3.7 billion by 2025. If we look at the mobile usage trends, half of all user growth comes from China, India, Indonesia, Nigeria, and Pakistan. There’s a noticeable decline in desktop usage everywhere, including the US. The rollout of 5G technology will further exacerbate this trend.
4. Smartphones dominate time spent with digital media (63%) compared to desktops (23%).
(Comscore)
There’s no denying that media mobile consumption is on the rise. The numbers don’t lie. There has been an evident decrease in digital media desktop use over the years. It went from 34% in 2017 to 23% two years later. While, according to mobile vs desktop statistics in 2019, time spent with digital media on phones has gone up from 50% in 2017 to 63% two years later.
Mobile vs Desktop Statistics in the US
It is interesting to look at how the battle between mobile vs desktop usage is transpiring in a country with the third-largest smartphone penetration in the world. Are smartphones taking over in the US?
5. 58% of all US web visits come from smartphones.
(Perficient)
A higher percentage than stats from other countries. This number comes from US mobile web browsing statistics in 2018, and it is a percentage of over 0.9 trillion visits. It also represents a surprising decline from 63% in 2017. Experts cannot pinpoint the reason for the rise of web-mobile visits in 2018, and then the number falling to where it was in 2016. Especially, given that there was no decline in the upwards trend anywhere, worldwide. It was climbing globally, and it was at an average of 52.2% in 2018.
6. Americans spent more time on websites while on a desktop computer (58%).
(Perficient)
This percentage is the total aggregated time across all visits for desktop access, compared with that of mobile. It shows that, while Americans visit websites more often via their phones, their stay through these devices is shorter, which makes sense given the size of smartphones. Surveys show that people prefer to read and watch videos on large screens. Also, this figure is a 7% increase from the year prior.
7. Americans spend five and a half minutes more per web visit on a desktop machine compared to mobile use.
(Perficient)
Mobile users want a quick fix. People are ready to pay more attention when they’re sitting in front of a desktop. Top statistics show this. It’s impractical to read complicated writing on a small screen. Furthermore, people also like to play browser games on desktop computers, some of which are role-playing multiplayer games that have users tied to their computers for hours. Most also prefer to watch tech tutorials, write on forums, use different kinds of intricate services, shop, and perform other activities online through a desktop computer.
8. The bounce rate for desktop is 32.6% compared to 67.4% for mobile use.
(Perficient)
For the uninformed, this is the percentage of visitors who navigate away from a site after viewing only one page. Web traffic comparisons in the US demonstrate that people are more patient on desktops, for many of the reasons we listed above. Nevertheless, mobile website experiences are improving, screens are getting bigger, and smartphones are starting to handle more complex tasks. People are also getting more comfortable navigating sites via their phones.
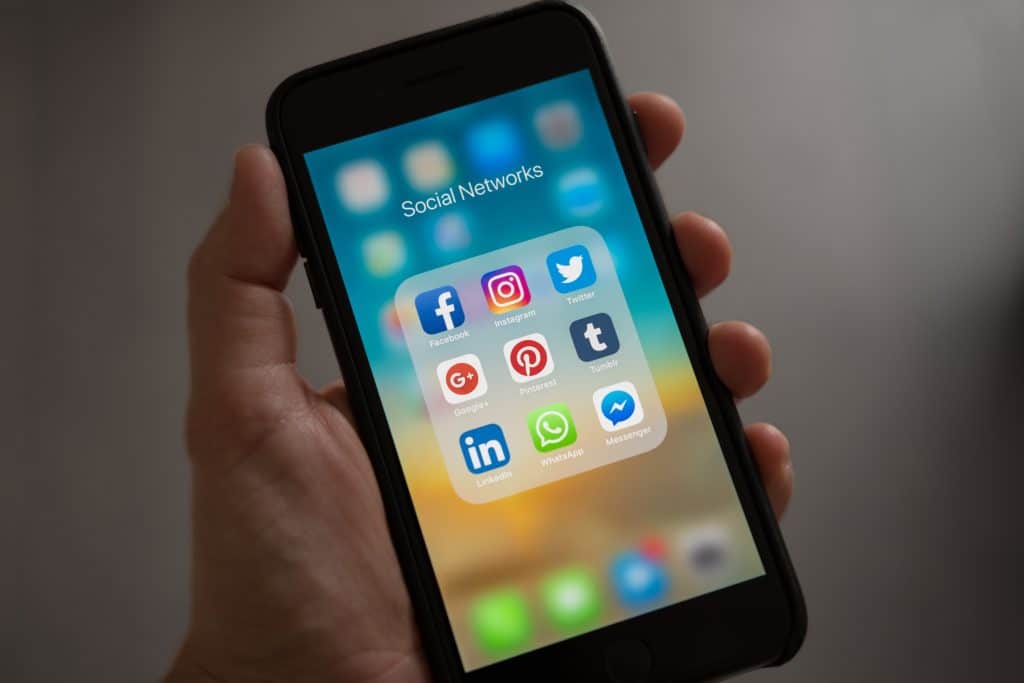
Social Networks and Mobile vs Desktop Usage
The first social media site, Six Degrees, came into existence in 1997. It wasn’t until My Space that the concept exploded into the phenomena that it is today, one that drives mobile devices sales. Facebook is still the king with 2.3 billion users, but other contenders have emerged over the years. Let’s see how these networks are present in our mobile vs desktop usage analysis.
9. There are 4.08 billion active mobile social media users.
(Statista)
There are also 4.66 billion active internet users. That is approximately 59% of the global population. 82% of them use their phones to access social media platforms. Furthermore, only 1.3% of people who are a member of a social network do not use a mobile phone to access that site. What’s even more staggering is that only less than 200 million mobile internet users do not visit social media sites. Meaning, these networks have everyone hooked. If you have a phone, you likely have an account.
10. 98.2% of users access Facebook from a mobile phone.
(Statista)
It matches the current trend to a tee. If we compare Facebook’s mobile vs desktop usage, we can see that only 1.8% of people exclusively use the site from a laptop or a desktop computer. 20% do from both, and a whopping 78% of people only visit the site through a mobile phone. They do not bother opening Facebook when using a computer. To them, Facebook is a mobile thing.
11. Nearly 85% of people access Pinterest from a mobile phone.
(Pinterest)
If you look at the numbers, there are 335 million people that use Pinterest every month. That means that 284 million users access the platform through a mobile phone. If we go into the mobile vs desktop traffic analysis, the Pinterest mobile traffic is almost six times that of the one generated by desktop access. Considering that 80% of Pinterest users are women, it is they who have shunned desktop machines in favor of convenience. It seems everyone has career-minded people as well.
12. 57% of LinkedIn visits are through a smartphone.
(LinkedIn)
Though this is much lower than other social media sites, leaving the top network for lead generation, one with 675 million users as the platform with the most even mobile vs desktop usage stats. Experts chalk this up to the fact that LinkedIn is a more professional network that people use for work-related issues. Thus, users often access the platform from a desktop computer while they are at their place of business.
13. 70% of YouTube watch time comes from mobile devices.
(YouTube)
To get the full picture, know that over 2 billion users log in each month on Youtube, and people watch over a billion hours of video every day on the site, which amounts to billions of views. While there is a current disparity concerning Youtube mobile vs desktop usage, just a few years ago, desktop viewing accounted for almost 60% of the time spent watching videos online. The tide has shifted, and now mobile devices hold a comfortable lead.
Mobile vs Desktop Search Statistics
While there are many online search engines, we all know who the king is. Google has no rival, evident by the 3.5 billion searches per day on the site, with a search volume that grows by 10% each year. So, what kind of device do people use when they seek information? Well, read on, so when someone asks – what percentage of searches are mobile? You can answer.
14. 58% of the overall search query volume comes from mobile devices.
(Hitwise)
In 2020, Google was responsible for 94.49% of the mobile search market in the US. However, the American mobile numbers were slightly down from our listed average, as 56% of US residents used Google through a mobile device. This percentage varies between 51%-60%, depending on the country. Nevertheless, know that your device/computer plays a factor in what kind of search results you get.
15. 73% of organic searches show different results for mobile users vs desktop users.
(BrightEdge)
It’s not just what you search, but what type of device you are using to perform this action. As smartphones have become more prevalent, Google has evolved to cater to mobile searchers. The company is aligning itself to deliver an experience matched to a mobile searcher’s intent. Thus, it shows different results on a smartphone, then what a desktop search would yield. This gap is increasing year by year, and marketers that do not rank highly on smartphone-results lose out on opportunities to reach wider audiences.
16. Mobile ad expenditure in the US will hit 23.36 billion in 2021.
(Statista)
If you think that’s a lot, know that this number represents an increase of $9 billion from mobile ad expenditure in 2016. When we see numbers like these and the rest of the mobile vs desktop internet usage statistics, it becomes clear who’s winning this war. Overall mobile use climbs, and so do ads that target this audience. Total digital ad spending in the US exceeded $100 billion for the first time in 2018, and with the way mobile numbers are rising, mobile ads will become a larger piece of the pie, year by year.

M-Commerce vs E-Commerce Statistics
For the uninformed, m-commerce is the transaction of goods and services through devices such as smartphones and tablets. It is a form of e-commerce that enables users to do online shopping without a desktop computer.
17. M-commerce sales in 2020 were at $2.91 trillion.
(Oberlo)
If you’re not impressed, then you should know that this is a 25% increase from 2019. What other sector sees this kind of jump? Today, mobile devices account for two out of every three dollars spent on online purchases. The revenue sales in 2019 were double those of 2016, and there has been an average increase of 33.8%, year-on-year since 2016. The number of worldwide mobile users is growing, and so are the people that do their online shopping via a smartphone.
18. The number of mobile sales will increase by 22.3% in 2021.
(Oberlo)
It seems like everyone is going fully mobile, as mobile sales will hit $3.56 trillion in 2021. In 2014, the market share of internet usage through mobile phones was 26%. Since then, that figure has more than doubled. Consequently, m-commerce sales in total e-commerce sales have seen a jump of 28% since 2016. So, while it seems like phones are starting to dominate, and the mobile vs desktop traffic war is tipping in their favor, if we look at other stats, things begin to look less peachy.
19. The desktop conversion rate is almost double that of smartphones.
(SaleCycle)
If we look at the mobile traffic vs desktop influx in terms of online sales, we can see that many people like to browse for items on their smartphones. In fact, they browse 21% more via a smartphone, then on a computer. However, the conversion rate on these devices is just 2.25%. On a desktop machine, it is 4.81%. Even tablets do better, converting at 4.06% on average. Going by some older stats, 50% of all visits to retail websites come from mobile phones, but only 36% of all purchases take place through a mobile device. Clearly, people still perceive computers as a safer method of internet access.
20. 81.7% of all travel sales go through a desktop computer.
(SaleCycle)
It’s evident that when purchases are more expensive and complicated, people gravitate towards a PC. These devices offer superior navigation and bigger screens that provide better image visibility. The average mobile add to cart rate is 10.4%, compared to 12.9% for desktop. So, people are looking at buying an item through both devices at similar percentages, but they are more likely to bail out at checkout on a smartphone.
Mobile App vs Mobile Website Statistics
Let’s veer away from e-commerce and mobile vs desktop statistics, and have a look at what role apps play. These pieces of dedicated software have transformed all aspects of our daily lives. Thus, let us have a gander on how things stack up when we pit apps vs website use on mobile phones.
21. Apps account for 90% of the time on a smartphone.
(eMarketer)
According to mobile web browsing statistics from 2019, everyone is using apps. They account for over 90% of internet time on smartphones, and 77% of time spent on tablets. However, what is intriguing is that almost 50% of a person’s app use is on just one piece of software, and five or fewer apps are responsible for 90% of the time spent on a smartphone. One issue that apps face is that the difference between them and the web experience is fading. The long-term trend seems to be websites that offer an app-like experience, whether native or HTML-based.
22. 88% of mobile-only users use instant messaging apps.
(Comscore)
If a person is into social media and owns a smartphone, it is almost a given that he has his favorite platform’s app installed. The category of apps closest in popularity to instant messaging ones are lifestyle and dating apps (85%), followed by weather (81%) and navigation apps (76%). If people need quick and frequent access to something, they turn to dedicated software for convenience. Though, when it comes to education, they barely pick up a phone.
23. People older than 65 spend 44% of their digital minutes on mobile apps.
(Comscore)
In comparison, people older than 65 use 33% of their digital minutes on desktop computers and only 13% on mobile web browsing. Most people in this age category rarely even know what a tablet is, and they have likely never used one. All other age categories spend over 63% of their digital mobile minutes on apps, with 18 to 24-year-olds claiming the top spot with 72%. With these kinds of figures, soon there won’t be a need for any mobile internet usage vs desktop statistics articles. PCs will become a thing of the past, and dedicated software on small devices will rule the world.
In the Battle Between Mobile vs Desktop, Who Is Triumphant?
We all know that since the iPhone came around, smartphones have only grown in popularity. Not only that, but they also have quickly become an integral tool necessary for everyday life. While covering the topic of mobile vs desktop usage, it is clear that they are not just here to stay, but that they’re taking over.
Though sales of desktop computers are dropping, these machines remain relevant. For a while, at least. Especially regarding office work and for home-use by the everyday Joe or Jane.
For some things, you just need a good ole fashion computer. For gaming, work, education, entertainment. They are also essential for the development of the smartphone industry.
Thus, even though phones are winning the mobile vs desktop usage war, personal computers are still having their day in the sun, before they have to retreat to the shade.
Sources:
- BrightEdge
- Comscore
- eMarketer
- Hitwise
- Oberlo
- Perficient
- SaleCycle
- Statista
- Statista
- Statista
- Statista
- Statista
- Warc
- YouTube